
Page 32 - 2023年光通信竞争力报告(摘要版)
P. 32
20 The competitiveness report on the Top 10 competitiveness enterprises in the optical communications industry China & Global market in 2023 (17 ) (Abstract Edition)
th
The 17 th Ranking Event of Top 10 Competitiveness Enterprises in the Optical Communications of China & Global Market (2023)
Source of financial data Annual report of listed company Annual report of listed company Annual report of listed company Annual report of listed parent company Annual report of listed company Annual report of listed company Annual report of listed company Annual report of listed parent company Annual report of listed company Annual report of listed company
Rankings of the Top10 competitiveness enterprises in the optical components and auxiliary equipment field of China in 2023 (17 th )
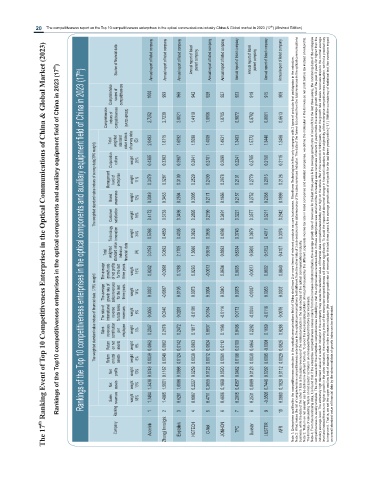
Rankings of the Top 10 competitiveness enterprises in the optical components and auxiliary equipment field of China in 2023 (17 th )
Comprehensive scores of competitiveness 1000 999 968 942 928 927 923 918 915 909
Comprehensive indexs of competitiveness $ % 2.7252 2.7239 2.0021 1.4110 1.0906 1.0705 0.9872 0.8792 0.8061 0.6613
Total Corporation weighted culture standard value indexs of survey data weight (B) 25% 2.0483 0.4385 1.8715 0.3383 1.6092 0.2987 1.5098 0.2841 1.4009 0.2781 1.4931 0.2699 1.3463 0.2241 1.5772 0.2785 1.3448 0.2150 1.2458 0.2115
The weighted standard value indexs of survey data(30% weight) Management Brand level of awareness enterprise weight weight 11% 12% 0.3479 0.3049 0.3287 0.3453 0.3100 0.2504 0.2529 0.3005 0.2430 0.2171 0.2978 0.1666 0.2101 0.2157 0.2779 0.2752 0.2013 0.2058 0.2126 0.1899
Technology Customer satisfaction innovation weight weight 18% 34% 0.4172 0.5398 0.3733 0.4859 0.3496 0.4005 0.2895 0.3828 0.2790 0.3836 0.3491 0.4098 0.3221 0.3743 0.3577 0.3879 0.3211 0.4017 0.2942 0.3376 Note 2: What makes the list of comprehensive competitiveness enterprises in the optical communications field different from the other lists of 3 sub-sectors is the data resource of the sales revenues indicato
Total The average growth rate weighted of net profits standard value for the last indexs of three years financial data weight (A) 15% 3.0153 0.0242 3.0892 -0.0998 2.1705 0.1288 1.3686 0.0293 0.9576 -0.0073 0.8893 0.0604 0.8334 0.0605 0.5800 -0.0077 0.5752 0.0002 0.4107 0.0840 Note 1: Enterprises qualified for the competitiveness selection in the optical communications field of China shall have 2 or more items of relevant pro
The weighted standard value indexs of financial datač70% weightĎ The average The ratio of Sales growth rate of international revenues sales revenues revenue contribution for the last to total sales per three years revenues employee weight weight weight 14% 6% 5% 0.0037 0.0055 0.2047 -0.0887 0.0240 0.2178 0.0105 0.0208 0.2472 0.0073 -0.0101 0.1817 0.0004 0.0184 0.0937 0.0040 -0.0114 0.1196 0.0078 0.0173 0.0406 -0.0007
Net Return Return on net on total profits assets assets weight weight weight 8% 8% 13% 0.0062 0.0039 0.0749 0.0062 0.0049 0.1162 0.0142 0.0124 0.0998 0.0093 0.0039 0.0259 0.0024 0.0012 0.0123 0.0112 0.0061 0.0520 0.0109 0.0108 0.0482 0.0064 0.0030 0.0123 -0.0001 0.0005 0.0202 0.0025 0.0029 0.0112 The formula of calculating “return on net assets” is: Return on net assets=net profit before tax/ net assets. on overall
Net assets weight 13% 1.3438 1.5001 1.0086 0.2227 0.3655 0.1868 0.4357 0.0889 0.7446 0.1820
Sales revenues weight 18% 1.3484 1.4085 0.6281 0.8987 0.4711 0.4606 0.2015 0.2531 -0.3505 0.0880
Ranking 1 2 3 4 5 6 7 8 9 10
Company Accelink Zhongji Innolight Eoptolink HGTECH O-Net JONHON TFC Sunstar LUSTER AFR