
Page 30 - 2023年光通信竞争力报告(摘要版)
P. 30
18 The competitiveness report on the Top 10 competitiveness enterprises in the optical communications industry China & Global market in 2023 (17 ) (Abstract Edition)
th
The 17 th Ranking Event of Top 10 Competitiveness Enterprises in the Optical Communications of China & Global Market (2023)
Source of financial data Annual report of company for public Annual report of listed company Annual report of listed company Annual report of listed company Taxationǃresearch ˂ survey information˗self-reported figures and operators' tender results Annual report of listed company Annual report of listed company Annual report of listed company Taxationǃresearch ˂ survey information˗self-reported figures and operators' tender results Taxatio
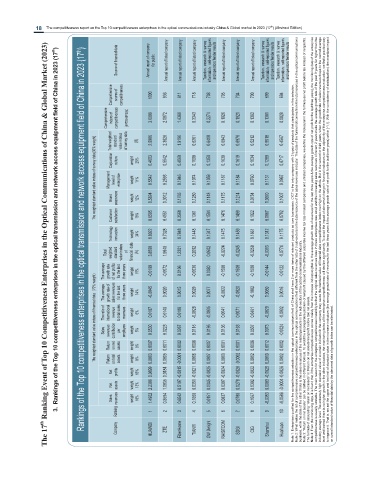
3. Rankings of the Top 10 competitiveness enterprises in the optical transmission and network access equipment field of China in 2023 (17 th )
Rankings of the Top 10 competitiveness enterprises in the optical transmission and network access equipment field of China in 2023 (17 th )
Comprehensive scores of competitiveness 1000 936 911 718 708 705 704 700 699 694
Comprehensive Total weighted indexs of standard competitiveness value indexs of survey data $ % (B) 3.6009 2.9986 2.0872 2.3026 1.4369 1.9196 0.3343 0.6261 0.2274 0.6408 0.1926 0.6943 0.1921 0.6976 0.1383 0.5212 0.1381 0.5518 0.0828 0.4567
The weighted standard value indexs of survey data(30% weight) Management Corporation Brand level of culture awareness enterprise weight weight weight 25% 11% 12% 0.4003 0.5542 0.5824 0.5542 0.2593 0.3012 0.4069 0.1946 0.1765 0.1098 0.1074 0.1280 0.1350 0.1059 0.1148 0.1630 0.1187 0.1175 0.1619 0.1184 0.1214 0.1034 0.0760 0.0734 0.1289 0.1131 0.0920 0.0717 0.0967 0.1007
Technology Customer satisfaction innovation weight weight 18% 34% 0.6595 0.8022 0.4551 0.7328 0.3568 0.7848 0.1361 0.1448 0.1504 0.1347 0.1476 0.1475 0.1499 0.1459 0.1022 0.1661 0.0867 0.1312 0.0702 0.1175 Note 2: What makes the list of comprehensive competitiveness enterprises in the optical communications field different from the other lists of 3 sub-sectors is the data resource of the sales revenues indicato
Total weighted standard value indexs of financial data (A) 3.8590 1.9948 1.2301 0.2092 0.0502 -0.0224 -0.0245 -0.0258 -0.0393 -0.0774
The average The average growth rate growth rate of of net profits sales revenues for the last for the last three years three years weight weight 15% 14% -0.0199 -0.0045 -0.0072 0.0020 0.0106 0.0015 -0.0036 0.0029 0.0080 0.0077 -0.1500 -0.0022 -0.1500 -0.0020 -0.1500 -0.1082 -0.0144 0.0060 -0.0122 0.0016 Note 1: Enterprises qualified for the competitiveness selection in the optical communications field of China shall have 2 or
The weighted standard value indexs of financial datač70% weightĎ The ratio of Sales international revenues revenue contribution to total sales per revenues employee weight weight 6% 5% 0.0187 0.0530 0.0148 0.0223 0.0188 0.0267 -0.0028 0.0116 -0.0035 0.0195 0.0041 0.0136 0.0071 0.0163 0.0461 0.0507 -0.0029 0.0073 -0.0032 -0.0024 business, while the data of the other 3 lists is the sales revenues of the related products in the sub
Net Return Return on net on total profits assets assets weight weight weight 8% 8% 13% 0.0007 0.0003 0.0899 0.0011 0.0005 0.0184 0.0002 -0.0001 -0.0015 0.0006 0.0006 -0.0021 0.0007 0.0007 -0.0025 0.0001 0.0000 -0.0024 0.0001 -0.0002 -0.0026 0.0006 0.0002 -0.0022 0.0012 0.0010 -0.0025 0.0002 0.0002 -0.0004 -0.0026 The formula of calculating “return on net assets” is: Return on net assets=net profit before tax/ net a
Net assets weight 13% 2.2306 1.0835 0.5197 0.0351 0.0045 0.0307 0.0278 0.0302 0.0003
Sales revenues weight 18% 1.4902 0.8594 0.6542 0.1668 0.0151 0.0837 0.0788 0.1067 -0.0353 -0.0586
Ranking 1 2 3 4 5 6 7 8 9 10
Company HUAWEI ZTE FiberHome TIANYI GW Delight RAISECOM SDGI CIG Shanshui Huahuan