
Page 10 - Market Analysis Report of Optical Communications Field in China & Global market 2022
P. 10
C H I N A
Country USA China China Italy Japan China China Japan China Japan
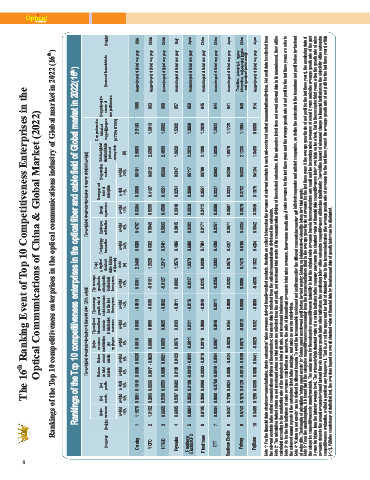
Rankings of the Top 10 competitiveness enterprises in the optical communications industry of Global market in 2022 (16 th )
Source of financial data Annual report of listed company Annual report of listed company Annual report of listed company Annual report of listed company Annual report of listed company Annual report of listed company Annual report of listed company Annual report of listed company Taxationǃresearch ˂ survey information˗self-reported figures and operators' tender results Annual report of listed company
Rankings of the Top 10 competitiveness enterprises in the optical fiber and cable field of Global market in 2022 16 th
The 16 th Ranking Event of Top 10 Competitiveness Enterprises in the
Comprehensive scores of competitiveness 1000 963 960 957 950 945 944 941 940 914
Optical Communications of China & Global Market (2022)
Comprehensive Total weighted indexs of standard value competitiveness indexs of survey data (A*70%+B*30%) (B) 2.5103 2.9059 1.6813 2.6585 1.6092 2.4899 1.5392 1.9629 1.3868 2.2023 1.2629 2.1006 1.2622 1.8036 1.1728 1.9079 1.1604 2.1233 0.5666 1.6480
The weighted standard value indexs of survey data(30% weight) Management Corporation Brand level of culture awareness enterprise weight weight weight 25% 11% 12% 0.6101 0.3500 0.6384 0.4912 0.4197 0.5295 0.5266 0.4551 0.4508 0.4347 0.3254 0.3348 0.5117 0.3686 0.3328 0.3788 0.3551 0.3412 0.3562 0.3327 0.3566 0.4239 0.3324 0.3597 0.4333 0.3782 0.3679 0.4134 0.1975 0.3045
Technology Customer satisfaction innovation weight weight 18% 34% 0.4707 0.8368 0.5849 0.6332 0.5093 0.5481 0.3845 0.4836 0.3202 0.6689 0.3171 0.7084 0.3251 0.4330 0.3671 0.4247 0.4334 0.5105 0.3042 0.4284 Note 1: For the financial data of sales revenues indicator, due to enterprises’ sales revenues derived from diversified products, the data we collect is based on the revenues of relevant products in each sub-sec
Total weighted standard value indexs of financial data (A) 2.3408 1.2625 1.2317 1.3576 1.0373 0.9039 1.0302 0.8578 0.7478 0.1032
The average The average growth rate growth rate of of net profits sales revenues for the last for the last three years three years weight weight 15% 14% 0.0301 -0.0019 -0.0161 -0.0100 -0.0127 -0.0032 0.0002 -0.0011 -0.0247 -0.0116 0.0225 -0.0049 -0.0255 0.0011 -0.0202 -0.0089 0.0065 0.0009 -0.4635 -0.0090
The weighted standard value indexs of financial datač70% weightĎ The ratio of Sales international revenues revenue contribution to total sales per revenues employee weight weight 6% 5% 0.0186 0.0010 0.0080 0.0089 0.0025 0.0059 0.0193 0.0076 0.0121 -0.0011 0.0088 0.0016 0.0048 0.0097 0.0154 -0.0026 -0.0018 0.0078 0.0182 -0.0020 the relevant products in the optical communications division of the enterprise; Net assets data is collect
Net Return Return on net on total profits assets assets weight weight weight 8% 8% 13% 0.0635 0.0099 0.1018 -0.0020 0.0017 0.0266 0.0021 0.0006 0.0559 0.0423 0.0120 0.0682 -0.0292 -0.0040 0.0108 -0.0218 -0.0033 0.0096 -0.0404 -0.0049 -0.0750 -0.0124 0.0005 0.0624 -0.0189 -0.0016 0.0129 0.0441 0.0065 0.0385 calculated according to the contribution rate of the enterprise’s total profit rate, net assets and total assets.
Net assets weight 13% 0.9301 0.2303 0.5150 0.5187 0.3956 0.2809 0.5300 0.1799 0.1675 0.1295
Sales revenues weight 18% 1.1878 1.0152 0.6655 0.6905 0.6894 0.6105 0.6304 0.6437 0.5743 0.3409
Ranking 1 2 3 4 5 6 7 8 9 10
Company Corning YOFC HTGD Prysmian Furukawa Electric/OFS FiberHome ZTT Sumitomo Electric Futong Fujikura
8