
Page 33 - Market Analysis Report of Optical Communications Field in China & Global market 2021
P. 33
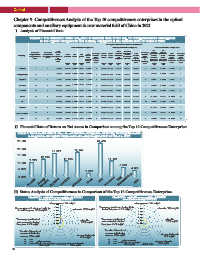
Ⅱ Financial Data of Return on Net Assets in Comparison among the Top 10 Competitiveness Enterprises

            Chart8-1 The financial data of return on net assets in comparison of the top 10 competitiveness
                enterprises in the optical transmission and network access equipment field of China in 2021


                     Huawei  ZTE  FiberHome  SDGI  Raisecom  GW  Nanjing   TIANYI  Shanshui  Symfun
                                                                           Telecom
                                                          Putian
          Ⅲ Status Analysis of Competitiveness in Comparison of the Top 10 Competitiveness Enterprises


                  Chart8-6 The competitiveness analysis of Raisecom    Chart8-10 The competitiveness analysis of Shanshui
                         in comparison during 2019-2021                              in 2021
                                sales revenues˄18% weight˅                           sales revenues˄18% weight˅

          The average growth rate of net profits for            net assets˄13% weight˅  The average growth rate of net profits for
            the last three years˄15% weight˅                    the last three years˄15% weight˅           net assets˄13% weight˅


           The average growth rate of              net profits  The average growth rate of              net profits
            sales revenues for the last            ˄13% weight˅  sales revenues for the last            ˄13% weight˅
            three years˄14% weight˅                             three years˄14% weight˅

             The ratio of international                           The ratio of international
              revenues to total sales            return on total assets  revenues to total sales
              revenues˄6% weight˅                  ˄8% weight˅    revenues˄6% weight˅                return on total assets
                                                                                                       ˄8% weight˅
                figures of 2019                                              sales revenues
                figures of 2020  sales revenues   return on net assets                            return on net assets
                figures of 2021 contribution per employee  Raisecom  ˄8% weight˅  figures of 2021 contribution per employee  Shanshui  ˄8% weight˅
                        ˄5% weight˅                                          ˄5% weight˅
         Ⅳ Analysis of Strength and Weakness of the Top 10 Competitiveness Enterprises in Competitiveness Index


           Table 8-2 The analysis of the strength and weakness index among the enterprises in the optical transmission and network access equipment field of China
                                                            Sales revenues  The ratio of  The average growth rate   The average growth rate
               Company  Ranking  Sales  Net assets Net profits  Return on  Return on  contribution per  international revenue  of sales revenues for the  of net profits for the
                             revenues          total assets net assets  employee  to total sales revenues  last three years    last three years
               HUAWEI          ĭ     ĭ     į     į      į      ĭ          į             į             į
                ZTE            ĭ     ĭ     į     į      į      ĭ          ĭ             į             į
              FiberHome        ĭ     ĭ     į     į      į      ĭ          ĭ             į             į
               SDGI            ĭ     ĭ     į     į      į      ĭ          ĭ             į             į
              RAISECOM         ĭ     ĭ     į     į      į      ĭ          ĭ             į             į
              GW Delight       į     į     į     į      į      ĭ          į             į             į
             Nanjing Putian     į    ĭ     į     ĭ      ĭ      ĭ          į             į             į
               TIANYI          į     į     į     ĭ      ĭ      ĭ          į             į             į
              Shanshui         ĭ     į     į     ĭ      ĭ      ĭ          į             ĭ             į
            Symfun Telecom      ĭ    į     ĭ     ĭ      ĭ      ĭ          į             ĭ             į

         V Analysis of Strength and Weakness of the Top 10 Competitiveness Enterprises in Competitiveness Index

          Note6: The financial data of competitiveness is formed by 9 indicators of certain weight, and the strength and weakness indicators are different in each
          company. We classify the 9 indicators into 2 sorts: one is higher than the competitiveness score of the company, that is, these indicators improve the
          company's competitiveness, we call it the strength indicator; otherwise, it is weakness indicators. What the readers should be reminded is that we classify
          the sorts by the standard value of fundamental data in companies' competitiveness but not the average score of the whole industry. For example, Prysmian's
          standard value of the net assets is 0.6904, above the average value, and above the standard value of the company's competitiveness, thus we put it into
          strength indicator. In the tables, the strength indicator is labeled by "↑", and weakness indicator by "↓". With the indicators divided into 2 sorts, the
          enterprises can pay more attention to their weakness ones, which oriented their effort to improve the competitiveness. As for the order of the indicators to
          draw attention, you can refer to the indicators of the corporators’ specific data to determine.

             【For more details of status analysis of the related enterprises, please refer to " The competitiveness report on The top 10 competitiveness enterprises
                                                              th
         in the optical communications industry of China & Global market in 2021 (15 ) (Integrated Edition)" 】
                                                                                                                    31