
Page 14 - Market Analysis Report of Optical Communications Field in China & Global market 2020
P. 14
͐ ͕ ͖ ͛ ͎
Source of financial data Annual report Annual report of of company listed Subsidiary for public company Annual report of listed company Annual report of listed company Annual report of listed company Taxationǃresearch ˂ survey information˗self-reported figures and operators' tender results Annual report of listed company Annual report of listed company Annual report of listed company Taxationǃresearch ˂ survey information˗self-report
The ranking of "the Top 10 competitiveness enterprises in the optical communications field of China in 2020"
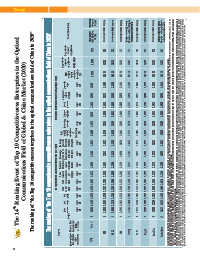
The ranking of "the Top 10 comprehensive competitiveness enterprises in the optical communications field of China in 2020"
The 14 th Ranking Event of Top 10 Competitiveness Enterprises in the Optical
Comprehensive scores of competitiveness 1000 923 902 900 899 846 844 800 799
Comprehensive indexs of competitiveness $ % 3.2921 1.5089 0.8402 0.8278 0.8176 0.4801 0.4425 0.0464 0.0330
Communications Field of Global & China Market (2020)
Total Corporation culture weighted standard value indexs of survey data weight (B) 25% 2.3039 0.4416 1.9924 0.4789 1.3725 0.2982 1.3267 0.2663 1.3054 0.2648 0.8048 0.1796 0.8119 0.2018 0.7498 0.1962 0.7396 0.1821
The weighted standard value indexs of survey data(30% weight) Management Brand level of awareness enterprise weight weight 11% 12% 0.3587 0.2582 0.2605 0.2146 0.2526 0.2511 0.2601 0.2643 0.2404 0.2303 0.1183 0.1567 0.1797 0.1678 0.1408 0.1701 0.1719 0.1628
Technology Customer satisfaction innovation weight weight 18% 34% 0.5205 0.7249 0.3721 0.6664 0.3249 0.2457 0.2746 0.2612 0.2837 0.2861 0.1175 0.2327 0.1315 0.1311 0.1340 0.1088 0.1261 0.0967
Total weighted standard value indexs of financial data (A) 3.7156 1.3017 0.6121 0.6140 0.6085 0.3410 0.2843 -0.2551 -0.2698 Note 2: What makes the list of comprehensive competitiveness enterprises in the optical communications field different from the other lists of 3 sub-sectors is the data resource of the sales revenues indicator. The data of the former list comes from the total revenues in the optical communications business, while
The average The average growth rate growth rate of of net profits sales revenues for the last for the last three years three years weight weight 15% 14% 0.1500 0.0971 0.1500 -0.0840 0.0121 0.1101 -0.1087 0.1367 0.1222 0.0816 0.1500 -0.0480 0.1500 0.0228 -0.1500 0.0209 0.1500 -0.0677 Note 1: Enterprises qualified for the competitiveness selection in the optical communications field of China shall have 2 or more items of relev
The weighted standard value indexs of financial datač70% weightĎ The ratio of Sales international revenues revenue contribution to total sales per revenues employee weight weight 6% 5% 0.1388 0.1209 0.1194 0.0165 0.0273 0.0323 0.0886 0.0810 -0.0083 0.0600 0.0282 0.0163 0.0785 0.0285 0.0046 -0.0007 0.0063 0.0031
Net Return Return on net on total profits assets assets weight weight weight 8% 8% 13% 0.1070 0.0245 0.6031 0.0992 0.0030 0.1078 0.0333 -0.0034 -0.0065 0.0292 0.0066 -0.0032 0.0221 0.0041 -0.0119 0.0429 0.0037 -0.0012 -0.0176 -0.0126 -0.0186 -0.0246 -0.0111 -0.0175 -0.0037 -0.0254 -0.1195 -0.0555 -0.0389 -0.0268
Net assets weight 13% 1.2031 0.3534 0.0905 0.0480 0.0474 0.0775 data of the other 3 lists is the sales revenues of the related products in the sub-sectors of the optical communications industry.
Sales revenues weight 18% 1.2711 0.5363 0.3165 0.3358 0.2912 0.1668 -0.0173 -0.0722 -0.1209
Ranking 1 3 4 5 6 7 8 9 10 “return on net assets” is: Return on net assets=net profit before tax/ net assets.
The group of two items products in optical communication Huawei
Company ZTE HTGD ZTT Futong SDGI Zhongli Yongding Fuchunjiang
The group of three items products in optical communication CICT
14