
Page 35 - Market Analysis Report of Optical Communications Field in China & Global market 2019
P. 35
Chapter 9 Competitiveness Analysis of "the Top 10 competitiveness enterprises in the optical
components and auxiliary equipment & raw material field of China in 2019"
Ⅰ Analysis of Financial Data
Table9-1 The standard value weighted of financial data of the top 10 competitiveness enterprises
in the optical components and auxiliary equipment & raw material field of China in 2019
The standard value weighted of financial data
Scale sub-factors˄weight 44%˅ Efficiency sub-factors˄weight 27%˅ Increase sub-factors˄weight 29%˅
Total The The
average
The ratio of
average
Sales
Ranking of Ranking of standard Return Return revenues international Ranking of growth rate growth rate
Total
Total
Total
Company comprehensive financial data value Sales Net Net standard Ranking of on total on net contribution revenue standard standard of sales of net standard Ranking of
standard
standard
competitiveness competitiveness weighted of revenues assets profit value
revenues
per
profit
index index the value value assets assets employee to total sales value weighted for the last for the last value value
revenues
financial data weighted weighted weighted of weighted weighted
of scale of scale of efficiency efficiency three years three years of increase of increase
weight weight weight index index weight weight weight weight index index weight weight index index
18% 13% 13% 8% 8% 5% 6% 14% 15%
Accelink 1 1 2.3405 1.2238 0.7368 0.0391 1.9997 1 0.0026 0.0047 0.1519 0.0049 0.1640 3 0.1400 0.0369 0.1769 9
Zhongji Innolight 2 2 2.3374 1.2414 0.4226 0.0774 1.7414 2 0.0053 0.0089 0.2923 -0.0005 0.3060 2 0.1400 0.1500 0.2900 1
O-net 3 3 1.1080 0.4296 0.2643 0.0252 0.7190 4 0.0054 0.0072 0.0664 0.0199 0.0989 6 0.1400 0.1500 0.2900 1
TIANYI 4 4 1.1062 0.5581 0.2096 0.0156 0.7833 3 0.0031 0.0050 0.1009 -0.0146 0.0945 8 0.1400 0.0885 0.2285 7
HGTECH 5 5 0.8897 0.4158 0.0783 0.0072 0.5014 5 0.0015 0.0020 0.1017 -0.0069 0.0983 7 0.1400 0.1500 0.2900 1
HONGHUI 6 6 0.6561 0.1476 -0.1417 0.0011 0.0069 9 0.0039 0.0061 0.3654 -0.0153 0.3601 1 0.1395 0.1497 0.2891 6
JONHON 7 7 0.6559 0.3402 -0.0657 0.0003 0.2748 6 0.0051 0.0120 0.0849 -0.0109 0.0911 9 0.1400 0.1500 0.2900 1
T&S
Communications 8 8 0.5587 0.1542 0.0695 0.0157 0.2394 7 0.0080 0.0089 0.0657 0.0364 0.1190 5 0.1400 0.0602 0.2002 8
Eoptolink 9 9 0.3093 0.1517 0.0483 0.0000 0.2000 8 0.0005 -0.0003 0.1080 0.0111 0.1193 4 0.1400 -0.1500 -0.0100 11
TFC 10 10 0.3051 -0.0916 0.0314 0.0135 -0.0468 11 0.0088 0.0088 0.0407 0.0036 0.0619 10 0.1400 0.1500 0.2900 1
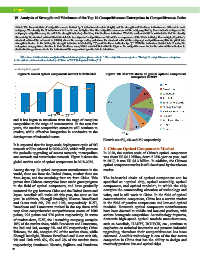
Ⅱ Financial Data of Return on Net Assets in Comparison among the Top 10 Competitiveness Enterprises
Chart9-1 The financial data of return on net assets in comparison of the top 10 competitiveness
enterprises in the optical components and auxiliary equipment field of China in 2019
Communications
Zhongji T&S
Accelink Innolight O-net TIANYI HGTECH HONGHUI JONHON Eoptolink TFC
Ⅲ Status Analysis of Competitiveness in Comparison of the Top 10 Competitiveness Enterprises
Chart9-6 The competitiveness analysis of HGTECH Chart9-8 The competitiveness analysis of JONHON
in comparison during 2017-2019 in comparison during 2017-2019
sales revenues˄18% weight˅ sales revenues˄18% weight˅
The average growth rate of net profit for 2.5000 net assets˄13% weight˅ The average growth rate of net profit for 2.5000
the last three years˄15% weight˅ 2.0000 the last three years˄15% weight˅ 2.0000 net assets˄13% weight˅
1.5000 1.5000
1.0000 1.0000
The average growth rate of 0.5000 net profit The average growth rate of 0.5000 net profit
sales revenues for the last 0.0000 ˄13% weight˅ sales revenues for the last 0.0000 ˄13% weight˅
three years˄14% weight˅ three years˄14% weight˅ -0.5000
-0.5000
The ratio of international The ratio of international
revenues to total sales return on total assets revenues to total sales return on total assets
revenues˄6% weight˅ revenues˄6% weight˅
˄8% weight˅ ˄8% weight˅
figures of 2017 figures of 2017 sales revenues
figures of 2018 sales revenues figures of 2018 return on net assets
figures of 2019 contribution per employee HGTECH return on net assets figures of 2019 contribution per employee JONHON ˄8% weight˅
˄5% weight˅ ˄8% weight˅ ˄5% weight˅
35