
Page 42 - 2019年光通信竞争力报告(摘要版)
P. 42
28 The competitiveness report on "the Top 10 competitiveness enterprises in the optical communications industry of Global & China market in 2019” (Abstract Edition)
The 13 th Ranking Event of Top 10 competitiveness enterprises in the optical communications field of Global & China Market (2019)
Country 64" 64" 64" $IJOB +BQBO $IJOB $IJOB +BQBO +BQBO $IJOB
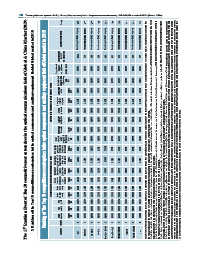
Ranking of "the Top 10 competitiveness enterprises in the optical components and auxiliary equipment field of Global market in 2019"
3. Ranking of the Top 10 competitiveness enterprises in the optical components and auxiliary equipment field of Global market in 2019
Source of financial data Annual report of listed company Annual report of listed company Annual report of listed company Annual report of listed company Annual report of listed company Annual report of listed company Annual report of listed company Annual report of listed company Annual report of listed company Annual report of listed company
Comprehensive score of competitiveness 1000 993 976 968 967 966 959 956 950 946
Comprehensive index of competitiveness $ % 2.7419 2.5908 2.1916 1.6539 1.6254 1.6052 1.3890 1.2736 1.0198 0.8305
Total standard Corporation value weighted culture of the survey data % weight 25% 2.4874 0.5839 2.4382 0.6592 2.4012 0.6255 2.2075 0.6065 2.2887 0.6483 1.6002 0.5803 2.0877 0.6203 2.1874 0.5244 2.0747 0.4007 2.0178 0.6374
Standard value weighted of the survey data(30% weight) Management Brand level of awareness enterprise weight weight 11% 12% 0.2934 0.4363 0.2839 0.3894 0.2686 0.3711 0.2914 0.3780 0.2071 0.3686 0.3404 0.2920 0.1763 0.3501 0.2136 0.3629 0.3352 0.4477 0.2759 0.2921
Technology Customer satisfaction innovation weight weight 18% 34% 0.4424 0.7315 0.3778 0.7278 0.4179 0.7181 0.3614 0.5703 0.4984 0.5662 0.2899 0.5836 0.3505 0.5903 0.3736 0.7129 0.4561 0.4349 0.3063 0.5061 Note 1: For the financial data of sales revenues indicator, due to enterprises’ sales revenues derived from diversified products, the data we collect is based on the revenues of relevant products in each sub-s
Total standard value weighted of the financial data $ 2.8510 2.6562 2.1017 1.4167 1.3412 1.6074 1.0895 0.8820 0.5677 0.3216
The average The average growth rate growth rate of of net profit sales revenues for the last for the last three years three years weight weight 15% 14% 0.1496 -0.0165 0.1249 0.0483 -0.1500 0.0006 0.0016 0.0038 -0.0049 -0.0152 0.0698 0.0408 0.0066 0.0098 0.0050 -0.0139 0.0332 -0.0140 0.0275 0.0232
Standard value weighted of the financial data(70% weight) The ratio of Sales international revenues Return revenue contribution on net to total sales per assets revenues employee weight weight weight 6% 5% 8% 0.0175 -0.0235 -0.0025 0.0353 0.0708 0.0108 0.0381 0.0506 0.0084 -0.0033 -0.0097 0.0047 0.0148 -0.0255 0.0060 -0.0104 0.0244 0.0089 0.0006 -0.0113 0.0042 0.0169 -0.0206 0.0067 0.0054 -0.0
Net Return on total profit assets weight weight 8% 13% -0.0014 -0.0472 0.0057 0.2303 0.0049 0.2110 0.0026 0.0391 0.0035 0.1020 0.0053 0.0768 0.0023 0.0351 0.0020 0.0777 0.0046 0.0679 0.0054 0.0252 calculated according to the contribution rate of the enterprise’s total profit rate, net assets and total assets. the released annual reports of the enterprises listed in the rankings, and make no more in subdivisio
Net assets weight 13% 0.1283 0.2034 0.0643 0.0247 0.1168 0.0137 0.0204 0.0342 0.0466 0.0056
Sales revenues weight 18% 2.6467 1.9267 1.8738 1.3533 1.1437 1.3780 1.0218 0.7740 0.4248 0.2414
Ranking 1 2 3 4 5 6 7 8 9 10
Company II-VI Broadcom Lumentum Accelink Sumitomo Electric Zhongji Innolight Hisense Broadband Fujikura Furukawa Electric O-net