
Page 40 - 2019年光通信竞争力报告(摘要版)
P. 40
26 The competitiveness report on "the Top 10 competitiveness enterprises in the optical communications industry of Global & China market in 2019” (Abstract Edition)
The 13 th Ranking Event of Top 10 competitiveness enterprises in the optical communications field of Global & China Market (2019)
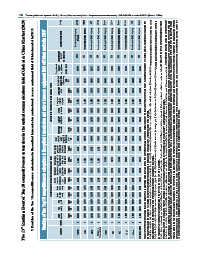
Country China Finland USA China Japan China Japan Germany USA Japan
2. Ranking of the Top 10 competitiveness enterprises in the optical transmission and network access equipment field of Global market in 2019
Ranking of "the Top 10 competitiveness enterprises in the optical transmission and network access equipment field of Global market in 2019"
Source of financial data Annual report of company for public Annual report of listed company Annual report of listed company Annual report of listed company Annual report of listed company Annual report of listed company Annual report of listed company Annual report of listed company Annual report of listed company Annual report of listed company
Comprehensive score of competitiveness 1000 929 921 918 910 905 903 901 893 890
Comprehensive index of competitiveness $ % 3.2787 1.6076 1.3900 1.2078 0.9068 0.6789 0.6193 0.5574 0.3308 0.2356
Total standard Corporation value weighted culture of the survey data % weight 25% 2.8358 0.5842 2.6059 0.6481 2.2130 0.4575 2.1727 0.4368 2.1917 0.6102 2.1562 0.4237 2.1313 0.5983 2.0823 0.5487 2.4141 0.5569 2.1238 0.6091
Standard value weighted of the survey data(30% weight) Management Brand level of awareness enterprise weight weight 11% 12% 0.3720 0.6609 0.2913 0.4691 0.1631 0.5356 0.4692 0.4266 0.3638 0.3075 0.4310 0.4246 0.3516 0.2954 0.2210 0.3466 0.3343 0.4357 0.1981 0.3298
Technology Customer satisfaction innovation weight weight 18% 34% 0.6263 0.5924 0.4611 0.7365 0.4013 0.6553 0.4124 0.4278 0.3054 0.6048 0.4284 0.4484 0.2933 0.5926 0.4418 0.5242 0.4947 0.5925 0.4595 0.5273 Note 1: For the financial data of sales revenues indicator, due to enterprises’ sales revenues derived from diversified products, the data we collect is based on the revenues of relevant products in each sub-s
Total standard value weighted of the financial data $ 3.4685 1.1798 1.0373 0.7943 0.3561 0.0458 -0.0288 -0.0961 -0.5620 -0.5737
The average The average growth rate growth rate of of net profit sales revenues for the last for the last three years three years weight weight 15% 14% 0.0027 0.1400 -0.0161 0.1400 0.0325 0.0078 0.0015 0.1290 -0.0021 -0.0811 -0.0128 -0.1087 -0.0065 -0.0911 0.0142 -0.0171 -0.0743 -0.0474 -0.0013 -0.0396
Standard value weighted of the financial data(70% weight) The ratio of Sales international revenues Return revenue contribution on net to total sales per assets revenues employee weight weight weight 6% 5% 8% 0.0432 0.2659 0.1391 0.1087 0.0808 -0.0420 0.0600 0.2314 0.0341 -0.0265 0.0717 0.0220 -0.0060 0.0737 0.0177 0.0039 0.0419 -0.1999 -0.0269 0.0597 0.0098 0.0461 0.1116 -0.0022 0.0434 0.0783
Net Return on total profit assets weight weight 8% 13% 0.1512 0.7651 -0.0882 -0.0624 0.0524 -0.0371 -0.0040 0.0046 0.0342 0.0001 -0.1836 -0.0972 -0.0172 -0.0009 -0.0186 -0.0054 -0.3086 -0.0255 0.0582 0.0042 calculated according to the contribution rate of the enterprise’s total profit rate, net assets and total assets. the released annual reports of the enterprises listed in the rankings, and make no more in
Net assets weight 13% 0.9453 0.6058 0.2294 0.1458 0.2294 0.4809 0.1072 -0.0645 0.0110 0.1525
Sales revenues weight 18% 1.0160 0.4532 0.4267 0.4501 0.0904 0.1213 -0.0629 -0.1602 -0.0466 -0.8413
Ranking 1 2 3 4 5 6 7 8 9 10
Company Huawei Nokia Ciena FiberHome Communications Fujitsu ZTE NEC ADVA Infinera Sumitomo Electric