
Page 32 - 2019年光通信竞争力报告(摘要版)
P. 32
18 The competitiveness report on "the Top 10 competitiveness enterprises in the optical communications industry of Global & China market in 2019” (Abstract Edition)
The 13 th Ranking Event of Top 10 competitiveness enterprises in the optical communications field of Global & China Market (2019)
Source of financial data Annual report of listed company Annual report of listed company Annual report of listed company Annual report of listed company Annual report of listed parent company Annual report of listed company Annual report of listed company Annual report of listed company Annual report of listed company Annual report of listed company
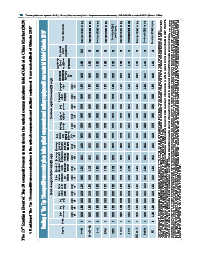
4. Ranking of "the Top 10 competitiveness enterprises in the optical components and auxiliary equipment & raw materialfield of China in 2019"
Ranking of "the Top 10 competitiveness enterprises in the optical components and auxiliary equipment & raw material field of China in 2019"
Comprehensive score of competitiveness 1000 998 945 943 935 927 926 923 914 913
Comprehensive index of competitiveness $ % 2.3288 2.3005 1.2765 1.2422 1.0886 0.9321 0.9316 0.8465 0.6780 0.6759
Total standard Corporation value weighted culture of the survey data % weight 25% 2.3016 0.5051 2.2142 0.3918 1.6696 0.4183 1.5595 0.2655 1.5526 0.2910 1.5760 0.2793 1.5749 0.2734 1.5182 0.2485 1.5382 0.2456 1.5411 0.2576
Standard value weighted of the survey data(30% weight) Management Brand level of awareness enterprise weight weight 11% 12% 0.3478 0.3043 0.4020 0.4480 0.2321 0.2165 0.2799 0.2747 0.2594 0.3166 0.2771 0.2740 0.3346 0.1993 0.2418 0.2385 0.2547 0.2624 0.2553 0.2652
Technology Customer satisfaction innovation weight weight 18% 34% 0.4177 0.7267 0.4338 0.5388 0.2795 0.5231 0.3523 0.3871 0.2966 0.3889 0.3589 0.3867 0.3416 0.4259 0.3549 0.4346 0.3590 0.4165 0.3559 0.4071 Note 2: What makes the list of comprehensive competitiveness enterprises in the optical communications field different from the other lists of 3 sub-sectors is the data resource of the sales revenues indicato
Total standard value weighted of the financial data $ 2.3405 2.3374 1.1080 1.1062 0.8897 0.6561 0.6559 0.5587 0.3093 0.3051 Note 1: Enterprises qualified for the competitiveness selection in the optical communications field of China shall have 2 or more items of relevant products as core businesses. FiberHome Technologies is the only company with 3 types of products that participates in the selection.
The average The average growth rate growth rate of of net profit sales revenues for the last for the last three years three years weight weight 15% 14% 0.0369 0.1400 0.1500 0.1400 0.1500 0.1400 0.0885 0.1400 0.1500 0.1400 0.1497 0.1395 0.1500 0.1400 0.0602 0.1400 -0.1500 0.1400 0.1500 0.1400
Standard value weighted of the financial data(70% weight) The ratio of Sales international revenues Return revenue contribution on net to total sales per assets revenues employee weight weight weight 6% 5% 8% 0.0049 0.1519 0.0047 -0.0005 0.2923 0.0089 0.0199 0.0664 0.0072 -0.0146 0.1009 0.0050 -0.0069 0.1017 0.0020 -0.0153 0.3654 0.0061 -0.0109 0.0849 0.0120 0.0364 0.0657 0.0089 0.0111 0.1080
Net Return on total profit assets weight weight 8% 13% 0.0026 0.0391 0.0053 0.0774 0.0054 0.0252 0.0031 0.0156 0.0015 0.0072 0.0039 0.0011 0.0051 0.0003 0.0080 0.0157 0.0005 0.0000 0.0088 0.0135 The formula of calculating “return on net assets” is: Return on net assets=net profit before tax/ net assets. on overall standard value of financial data by the abnormal data of growth index can be eliminated.
Net assets weight 13% 0.7368 0.4226 0.2643 0.2096 0.0783 -0.1417 -0.0657 0.0695 0.0483 0.0314
Sales revenues weight 18% 1.2238 1.2414 0.4296 0.5581 0.4158 0.1476 0.3402 0.1542 0.1517 -0.0916
Ranking 1 2 3 4 5 6 7 8 9 10
Company Accelink Zhongji Innolight O-net TIANYI HGTECH HONGHUI JONHON T&S Communications Eoptolink TFC