Page 33 - Market Analysis Report of Optical Communications Field in China & Global market 2015
P. 33

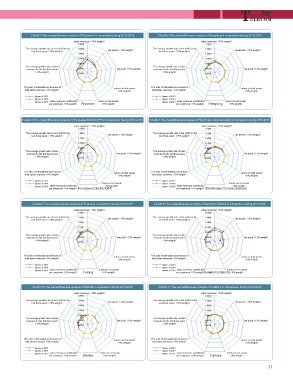
Chart9-4 The competitiveness analysis of Prysmian in comparison during 2013-2015                      Chart9-5 The competitiveness analysis of Hengtong in comparison during 2013-2015

                                               sales revenues˄18% weight˅                                                                            sales revenues˄18% weight˅
                                                    2.0000                                                                                                2.0000

The average growth rate of net profit for the  1.5000                      net assets˄13% weight˅     The average growth rate of net profit for the  1.5000                      net assets˄13% weight˅
        last three years˄15% weight˅           1.0000                                                         last three years˄15% weight˅           1.0000

The average growth rate of sales               0.5000                                                 The average growth rate of sales               0.5000
revenues for the last three years                                                                     revenues for the last three years
                                               0.0000                                                                                                0.0000
           ˄14% weight˅                                                                                          ˄14% weight˅
                                               -0.5000                     net profit˄13% weight˅                                                    -0.5000                     net profit˄13% weight˅
                                               -1.0000                                                                                               -1.0000

The ratio of international revenues to                                     return on total assets     The ratio of international revenues to                                     return on total assets
 total sales revenues˄6% weight˅                                               ˄8% weight˅             total sales revenues˄6% weight˅                                               ˄8% weight˅

figures of 2013                                 Prysmian  return on net assets                        figures of 2013                                Hengtong  return on net assets
figures of 2014                                              ˄8% weight˅                              figures of 2014                                             ˄8% weight˅
figures of 2015 sales revenues contribution                                                           figures of 2015 sales revenues contribution

                  per employee˄5% weight˅                                                                               per employee˄5% weight˅

Chart9-6 The competitiveness analysis of Furukawa Electric/OFS in comparison during 2013-2015         Chart9-7 The competitiveness analysis of FiberHome Communications in comparison during 2013-2015

                                               sales revenues˄18% weight˅                                                                            sales revenues˄18% weight˅
                                                     2.0000                                                                                               2.0000

The average growth rate of net profit for the   1.5000                     net assets˄13% weight˅     The average growth rate of net profit for the  1.5000                      net assets˄13% weight˅
        last three years˄15% weight˅            1.0000                                                        last three years˄15% weight˅           1.0000

The average growth rate of sales                0.5000                                                The average growth rate of sales               0.5000
revenues for the last three years                                                                     revenues for the last three years
                                                0.0000                                                                                               0.0000
           ˄14% weight˅                                                                                          ˄14% weight˅
                                               -0.5000                     net profit˄13% weight˅                                                    -0.5000                     net profit˄13% weight˅
                                               -1.0000                                                                                               -1.0000

The ratio of international revenues to                                     return on total assets     The ratio of international revenues to                                     return on total assets
 total sales revenues˄6% weight˅                                               ˄8% weight˅             total sales revenues˄6% weight˅                                               ˄8% weight˅

figures of 2013                                           return on net assets                        figures of 2013                                          return on net assets

figures of 2014    sales revenues contribution                          ˄8% weight˅                   figures of 2014    sales revenues contribution                      ˄8% weight˅
                   per employee˄5% weight˅
figures  of  2015                               Furukawa  Electric/OFS                                figures  of  2015  per employee˄5% weight˅ FiberHome     Communications

Chart9-8 The competitiveness analysis of Futong in comparison during 2013-2015                        Chart9-9 The competitiveness analysis of Sumitomo Electric in comparison during 2013-2015

                                               sales revenues˄18% weight˅                                                                            sales revenues˄18% weight˅
                                                    2.0000                                                                                                2.0000

The average growth rate of net profit for the  1.5000                      net assets˄13% weight˅     The average growth rate of net profit for the  1.5000                      net assets˄13% weight˅
        last three years˄15% weight˅           1.0000                                                         last three years˄15% weight˅           1.0000

The average growth rate of sales               0.5000                                                                                                 0.5000
revenues for the last three years                                                                                                                     0.0000
                                               0.0000                                                                                                -0.5000
           ˄14% weight˅                                                                                                                              -1.0000
                                               -0.5000                     net profit˄13% weight˅     The average growth rate of sales                                           net profit˄13% weight˅
                                               -1.0000
                                                                                                      revenues for the last three years
                                                                                                                ˄14% weight˅

The ratio of international revenues to                                        return on total assets  The ratio of international revenues to                                     return on total assets
 total sales revenues˄6% weight˅                                                  ˄8% weight˅          total sales revenues˄6% weight˅                                               ˄8% weight˅

figures of 2013                                           return on net assets                        figures of 2013
figures of 2014                                              ˄8% weight˅
figures of 2015 sales revenues contribution                                                           figures of 2014    sales revenues contribution                   return on net assets

                  per employee˄5% weight˅       Futong                                                figures  of  2015  per employee˄5% weight˅Sumitomo      Electric˄8% weight˅

Chart9-10 The competitiveness analysis of Sterlite in comparison during 2013-2015                     Chart9-11 The competitiveness analysis of Fujikura in comparison during 2013-2015

                                               sales revenues˄18% weight˅                                                                            sales revenues˄18% weight˅
                                                    2.0000                                                                                                2.0000

The average growth rate of net profit for the  1.5000                      net assets˄13% weight˅     The average growth rate of net profit for the  1.5000                      net assets˄13% weight˅
        last three years˄15% weight˅           1.0000                                                         last three years˄15% weight˅           1.0000

The average growth rate of sales               0.5000                                                 The average growth rate of sales               0.5000
revenues for the last three years                                                                     revenues for the last three years
                                               0.0000                                                                                                0.0000
           ˄14% weight˅                                                                                          ˄14% weight˅
                                               -0.5000                     net profit˄13% weight˅                                                    -0.5000                     net profit˄13% weight˅
                                               -1.0000
                                                                                                                                                     -1.0000

The ratio of international revenues to                                      return on total assets    The ratio of international revenues to                                     return on total assets
 total sales revenues˄6% weight˅                                                ˄8% weight˅            total sales revenues˄6% weight˅                                               ˄8% weight˅

figures of 2013                                 Sterlite  return on net assets                        figures of 2013                                Fujikura  return on net assets
figures of 2014                                              ˄8% weight˅                              figures of 2014                                             ˄8% weight˅
figures of 2015 sales revenues contribution                                                           figures of 2015 sales revenues contribution

                  per employee˄5% weight˅                                                                               per employee˄5% weight˅
   28   29   30   31   32   33   34   35   36   37   38