
Page 15 - Market Analysis Report of Optical Communications Field in China & Global market 2015
P. 15
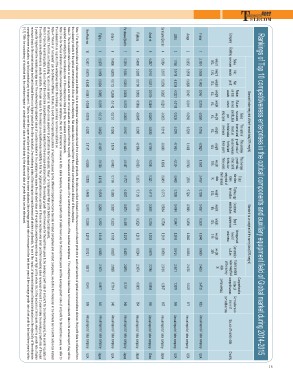
Rankings of Top 10 competitiveness enterprises in the optical components and auxiliary equipment field of Global market during 2014-2015
Standard value weighted of the financial data(70% weight) Standard value weighted of the survey data(30% weight)
Sales The ratio of The average The average Total Management Comprehensive
Return Return revenues international growth rate of growth rate standard level of index of
on total on net contribution revenue sales revenues of net profit value enterprise
assets assets per to total sales for the last for the last weighted of competitiveness
Standard value weiegmhtpeldoyoefethe firneavnecniauledsata(70th%reweeyigehatr)s three years the financial
Rankings of Top 10 competitiveness enterprises in the optical components and auxiliary equipment field of Global market during 2014-2015Company $
%
Sales Net Net Technology Customer Brand Corporation Total standard Comprehensive Source of financial data Country
Ranking revenues assets profit innovation satisfaction awareness culture value weighted score of
Standard value weighted of the survey data(30% weigohft)thdeastaurvey competitiveness
Company weight weight weight weight weight Swaeliegsht Theweraigtihotof Thewaevigehrat ge Thewaevigehrat ge Tdoattaal weight weight weight weight weight % Comprehensive Source of financial data Country
S1a8l%es 1N3e%t 1N3e%t oRne8tt%outranl Ron8e%tnuernt corenvtre5ibn%uuteiosn intreernv6ea%ntiuoneal sgarloewst1rhe4rv%aetneuoefs gorfonw1e5tth%prraotfeit stan$dard Tec3h4n%ology Cu1s8to%mer B1r2a%nd Malne1av1ge%el mofent Corp2o5r%ation index of Comprehensive
Finisar Total standard Annual report of listed company USA
Ranking revenues assets profit assets assets per to total sales for the last for the last value innovation satisfaction awareness enterprise culture value weighted competitiveness score of
of the survey competitiveness
1 2.1591 0.0636 0.1452 0.0451 0.0155 em-0p.0lo2y8e3e re0v.e0n1u8e5s th-r0e.e09y2e0ars thr0e.e15y0e0ars weighted of 0.7385 0.4257
0.3903 0.3045 0.6063 2d.4a6ta53 $
2.47%3
3 1000
the2f.i4n7a6n7cial %
weight weight weight weight weight weight weight weight weight data weight weight weight weight weight
15% $ 34% 18% 12% 11% 25%
18% 13% 13% 8% 8% 5% 6% 14%
Avago 2 0.9832 0.0519 0.0899 0.0101 0.0141 0.0583 0.0293 0.1400 -0.0793 1.2975 0.7294 0.3905 0.3890 0.2842 0.6554 2.4485 1.6428 977 Annual report of listed company USA
Finisar 1 2.1591 0.0636 0.1452 0.0451 0.0155 -0.0283 0.0185 -0.0920 0.1500 2.4767 0.7385 0.4257 0.3903 0.3045 0.6063 2.4653 2.4733 1000 Annual report of listed company USA
JDSU 3 1.0758 0.0778 -0.0314 -0.0221 -0.0100 0.0239 0.0076 -0.1400 -0.1334 0.8482 0.7298 0.4184 0.3847 0.2816 0.6426 2.4571 1.3309 968 Annual report of listed company USA
Avago 2 0.9832 0.0519 0.0899 0.0101 0.0141 0.0583 0.0293 0.1400 -0.0793 1.2975 0.7294 0.3905 0.3890 0.2842 0.6554 2.4485 1.6428
977 Annual report of listed company USA
SumitoJmDoSUElectric 34 10..06870548 00..00737787 -00..00333164 -00..00229271 -00..00211000 -00..00223296 00..00017160 --00..10430806 -00..01932394 00..88445812 00..75279782 00..54108944 00..33879467 00..22181861 00..66459263 22..43547361 11..23390497 996687 AAnnnnuuaall rreeppoorrtt ooff lliisstteedd ccoommppaannyy JUaSpaAn
SumiAtocmceoliEnklectric 45 0.64850474 0.0131771 0.0231361 0.0127997 0.0201508 -0.022606 -00..00101800 -0.10318668 -00..00932894 0.83245141 0.571727 0.53069284 0.37946 0.2912881 0.6059739 2.3214436 10.28984974 96575 Annual report of listed company JCahpinaan
AFcucjiekulinrak 56 00..44550407 00..00121851 00..00211910 00..00107393 00..00006598 --00..00224650 -00..00008850 --00..11218689 --00..00338534 00..33221754 00..75712197 00..33763286 00..33672994 00..22193286 00..56027494 22..21184764 00..88889545 995545 AAnnnnuuaall rreeppoorrtt ooff lliisstteedd ccoommppaannyy JCahpinaan
Fujikura 6 0.4500 0.0285 0.0190 0.0033 0.0069 -0.0245 0.0085 -0.1289 -0.0353 0.3275 0.7129 0.3736 0.3629 0.2136 0.5244 2.1874 0.8855 954 Annual report of listed company Japan
Furukawa Electric 7
0.3510 0.0334 0.0410 0.0034 0.0103 -0.0025 -0.0107 -0.1400 -0.1087 0.1772 0.4367 0.4579 0.4495 0.3370 0.4025 2.0836 0.7491 948 Annual report of listed company Japan
Furukawa Electric 7 0.3510 0.0334 0.0410 0.0034 0.0103 -0.0025 -0.0107 -0.1400 -0.1087 0.1772 0.4367 0.4579 0.4495 0.3370 0.4025 2.0836 0.7491 948 Annual report of listed company Japan
Oclaro 8 0.4506 -0.0035 0.0173 -0.2599 -0.1142 0.0157 0.0298 0.0214 -0.0403 0.1169 0.5925 0.3527 0.3523 0.1785 0.6225 2.0985 0.7114 946 Annual report of listed company USA
Oclaro 8 0.4506 -0.0035 0.0173 -0.2599 -0.1142 0.0157 0.0298 0.0214 -0.0403 0.1169 0.5925 0.3527 0.3523 0.1785 0.6225 2.0985 0.7114 946 Annual report of listed company USA
Fujitsu 9 0.0978 0.0658 0.0394 0.0082 0.0195 0.0121 -0.0020 -0.1400 -0.1500 -0.0492 0.5878 0.2931 0.2952 0.3449 0.5860 2.1070 0.5977 941 Annual report of listed company Japan
Fujitsu 9 0.0978 0.0658 0.0394 0.0082 0.0195 0.0121 -0.0020 -0.1400 -0.1500 -0.0492 0.5878 0.2931 0.2952 0.3449 0.5860 2.1070 0.5977 941 Annual report of listed company Japan
NNeeooPPhhoottoonniiccss 1100 00..22661177 --00..00007755 --00..00334400 --00..00664411 --00..00228866 --00..00221188 00..00225500 00..00116677 --00..00993366 00..00553388 00..44440088 00..22441100 00..22226688 00..22110066 00..55772211 11..66991133 00..55445511 993399 AAnnnnuuaall rreeppoorrtt ooff lliisstteedd ccoommppaannyy UUSSAA
Note 1: For the financial data of sales revenues indicator, due to enterprises’ sales revenues derived from diversified products, the data we collect is based on the revenues of relevant products in each sub-sectors of optical communications division. Net profit data is collected from
tthee rrelleevvaant pprooduuccttss iin tthe ooppticcall commmuuniiccationns diivviissioonn oof thhee eenteerpprriissee;; NNett asssettss ddatta iss colleecctteedd frrom tthe ooptiiccall ccommmmuniccaatiionns diviissionn off tthe enterrpprrisee.
NNoottee 22:: TThhee ccaallccuullaattiioonn ddaattaa ooff rreettuurrnn oonn nneett aasssseettss aanndd rreettuurrnn oonn ttoottaall aasssseettss aarree ccoolllleecctteedd ffrroomm tthhee nneett pprrooffiitt,, nneett aasssseettssaanndd ttoottaall aasssseettss ooff tthhee ccoommmmuunniiccaattiioonn ddiivviissiioonn ooff tthhee sseelleecctteedd eenntteerrpprriisseess.. IIff tthhee eenntteerrpprriissee lliisstteedd ddooeess nnoott rreevveeaall rreelleevvaanntt ddaattaa iinn iittss aannnnuuaall rreeppoorrtt,, tthheeyy wwiillll bbee
tNcNchaaooelltctceeruuell33laae::ttaeeAAsddsseaaffdooccrraccnootthhnrreedduiiannffoolgguurettrroopiinnotthhddreetiiccsaaccooottoofnnrrttthssrreiibboouuffettssniiooaatennlleerpssrraarrrittseeeeevvooseeffnnlittuushhteeeeessdeeccnninootteenntrrhttpprreiirrbbiirssuuaeettiin’’oossknnittnooppgtteeaasrrll, eeppammrrnoodppffiillttmoorryyaaaeettkeeeee,,,, nnntthheeoeettmaarraassottssriieooeettioossnffaasiinnnnuttddbeedrrttoonnivttaaaaisttlliiioooaannnssaa.sslleerrtteessvv.. eennuuee ttoo ttoottaall ssaalleess rreevveennuueess,, tthhee aavveerraaggee ggrroowwtthh rraattee ooff ssaalleess rreevveennuueess ffoorr tthhee llaasstt tthhrreeee yyeeaarrss aanndd tthhee aavveerraaggee ggrroowwtthh rraattee ooff nneett pprrooffiitt ffoorr tthhee llaasstt tthhrreeee yyeeaarrss,, wwee rreeffeerr ttoo
tNhoetere4le:a“Rseedtuarnnnounanl eretpaosrstsetosf” tchaenebnetedrepfriinseesd liinstdeidffeinretnhteforarmnkuinlag.sT,oaanvdomidatkheeninocmomorpeairnabsluebpdriovibslieomn. of net profit caused by the different corporate income tax rate in listed companies and unlisted companies, we define the molecular in the formula as net profit before tax instead
oNfontet4p:r“oRfietstu. rTnhoenfonremt ualsasoeftsc”aclcaunlabteingde“frienteudrninondifnferteanstsfeotrsm” uisla: .RTeotuarvnooidntnhetianscsoemtsp=anraebt lperopfriot bleefmoreoftanxe/tnperot faitscsaeutss;eRdebtuyrtnheonditfofetarel natssceotrsp=oNraettepinrocfoitms ebetafoxrerattaexi/ntolitsatleadscsoemtsp. anies and unlisted companies, we define the molecular in the formula as net profit before tax instead
Nofonteet5p:rForfoitms. Tthheemfoornmituolrainogf dcaaltcau, liat tiisngfo“urnedtutrhnaotnif ntheet aesnsteertsp”riisse: Rcoemtuprnetoitnivenneet sasssceotms=ensemt parinolfyit fbroemfortehetaixn/cnreeat saessinedtsic; aRtoertusr(nthoant itso,tathl easasveetrsa=gNeegt rporwoftihtsrabteefoorferetavxe/ntuoetasl faosrstehtes.last three years & the average growth rate of net profit for the last three years), the monitoring data of
tNhoeteen5t:eFrprorimsethcoemmpoentiittiovreinngesdsaitsa,uist uisalfloyuunndstthaabtleif. tThheeemntaeirnprriesaescoonmfopretthiteiveennetesrsprciosemceosmmpaeintitlyivefrnoemssthiensintacbreiliatyseisinthdaictathtoerso(rtighiantailss, athleesarveevreangueegsrboawsthe rinatteheosfereevnetneurpersisfeosr twhaeslassmt athllreaendyethaersin&crtehaesainvgersaagleesgrreovwethnureasteooffrenceet nptro2fiytefoarrsthmealaksettthhereaevyeeraagrse),gtrhoewmthornaittoeroinfgthdeatpaaostf
t33rcheoeyyvmeeeeaapnnrreusstteeitffsriaapvdrrreirhhsnoeiieggpshhscsoeetomrrevtttphhhaeaaelutnniantittvtohhieoreemnniie,annswlddsauuevisssfettirrnruyyadsgaauaevvaeeplllerryraaavuggecneetliscallteeanavvldbeewliellna...sTTytThhethoeeaedieemmxxthpttarrereeiornmmevreeeiesllaiyytn.shhooTiingghhhhaifgotsshrittseaat,hrnnwegddreaaeorrnwsddtetevvhtraaptihllnruueiseetheuooepcffpooaaetmhrccepeearerrnttitaanditiidinnvlioeciiwnnanddteoliiismccrssaai,tttinootohsrrfetiiannsmbtattihholnieetndyiacctiosoordrmmitnhvppgaaaatliunnntheyydeemminxoaaotryyhifgecctihnaaineauuclsserseeneatattlehhesreeseprssriienttsaavdenneiccddnaoaautmrroeddrspsvvebaa(tatillthuusiveeeeeaooinnvffeetffshiirnnsaeaagwsnneeicclliiegaadnrlleotddcewaalritpntthaareirsccaseooitgsemmnwoppiffeeaicrttsaiiettiisnvvvmeteelynnna.ueelTlessoasssnafiidonnvorddthieetdhexxetihoonlevvaceesriemrrt ahhtphsiiaggrinechhget ooosynnfaeattlaehhbrseensorww&ermhhvtooehallneeel uc..aehBBvsaeuunorttagfiinngereettihhcngeeefrnionsstweea2ccnthooycnneiraaddaltrieoosnrrdomttifhhcanaiirrketddeotryytpsheereaaoorrnfaisstvt,,hfewwoerrhhaoeetghbnneejetthhlgcaeetrsiovtggwittrryhtoohrwwoerftteahhtthyerreeaaoatteeefrnstooth)effewrssppiaartahillseesiensst
r[-e1v,e1n].uWesithdrtohpesctoontshiestneonrcmyaolfasvtaetriasgticealel tveeslta, nthdeinosvteeraddontheeirmepisacntoohnigohveerraglrloswtathndinartdhevaoltuheeroifnfdinicaantcoirasl,dthaetamboyntihtoerianbgnionrdmeaxlodfathtaeoefngterorpwrtihseincdoemxpceatnitibveeneelismsiwnailtledde.cline significantly. To avoid the impact of abnormal change in financial indicators on the objectivity of the enterprise
competitiveness evaluation, we find a practical way to improve it. That is, we set the upper and low limit of standard value in the increase indicators (the average growth rate of revenues for the last three years & the average growth rate of net profit for the last three years) within
[-1,1]. With the consistency of statistical test, the overdone impact on overall standard value of financial data by the abnormal data of growth index can be eliminated.