
Page 26 - Market Analysis Report of Optical Communications Field in China & Global market 2021
P. 26
͐ ͕ ͖ ͛ ͎
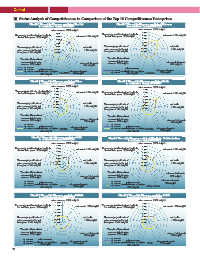
Ⅲ Status Analysis of Competitiveness in Comparison of the Top 10 Competitiveness Enterprises
Chart4-2 The competitiveness analysis of Huawei Chart4-3 The competitiveness analysis of Ericsson
in comparison during 2019-2021 in comparison during 2020-2021
sales revenues˄18% weight˅ sales revenues˄18% weight˅
The average growth rate of net profits for
The average growth rate of net profits for net assets˄13% weight˅ net assets˄13% weight˅
the last three years˄15% weight˅ the last three years˄15% weight˅
The average growth rate of net profits The average growth rate of net profits
sales revenues for the last ˄13% weight˅ sales revenues for the last ˄13% weight˅
three years˄14% weight˅ three years˄14% weight˅
The ratio of international The ratio of international
revenues to total sales return on total assets revenues to total sales return on total assets
revenues˄6% weight˅ revenues˄6% weight˅ ˄8% weight˅
˄8% weight˅
figures of 2019
figures of 2020 sales revenues sales revenues return on net assets
figures of 2021 contribution per employee return on net assets figures of 2020 contribution per employee Ericsson
figures of 2021
˄5% weight˅ HUAWEI ˄8% weight˅ ˄5% weight˅ ˄8% weight˅
Chart4-4 The competitiveness analysis of Ciena Chart4-5 The competitiveness analysis of Nokia
in comparison during 2019-2021 in comparison during 2019-2021
sales revenues˄18% weight˅ sales revenues˄18% weight˅
The average growth rate of net profits for net assets˄13% weight˅ The average growth rate of net profits for
the last three years˄15% weight˅ net assets˄13% weight˅
the last three years˄15% weight˅
The average growth rate of net profits The average growth rate of net profits
sales revenues for the last ˄13% weight˅ sales revenues for the last
three years˄14% weight˅ three years˄14% weight˅ ˄13% weight˅
The ratio of international The ratio of international
revenues to total sales return on total assets revenues to total sales
revenues˄6% weight˅ ˄8% weight˅ revenues˄6% weight˅ return on total assets
˄8% weight˅
figures of 2019 figures of 2019
figures of 2020 sales revenues return on net assets figures of 2020 sales revenues
figures of 2021 contribution per employee CIENA figures of 2021 contribution per employee NOKIA return on net assets
˄5% weight˅ ˄8% weight˅ ˄5% weight˅ ˄8% weight˅
Chart4-6 The competitiveness analysis of ZTE Chart4-7 The competitiveness analysis of FiberHome Communications
in comparison during 2019-2021 in comparison during 2019-2021
sales revenues˄18% weight˅ sales revenues˄18% weight˅
The average growth rate of net profits for net assets˄13% weight˅ The average growth rate of net profits for net assets˄13% weight˅
the last three years˄15% weight˅ the last three years˄15% weight˅
The average growth rate of net profits The average growth rate of net profits
sales revenues for the last ˄13% weight˅ sales revenues for the last ˄13% weight˅
three years˄14% weight˅ three years˄14% weight˅
The ratio of international The ratio of international return on total assets
revenues to total sales return on total assets revenues to total sales
revenues˄6% weight˅ ˄8% weight˅ revenues˄6% weight˅ ˄8% weight˅
figures of 2019 sales revenues figures of 2019 return on net assets
figures of 2020 figures of 2020 sales revenues ˄8% weight˅
figures of 2021 contribution per employee return on net assets figures of 2021 contribution per employee FiberHome
˄5% weight˅ ZTE ˄8% weight˅ ˄5% weight˅
Chart4-8 The competitiveness analysis of ADVA Chart4-9 The competitiveness analysis of NEC
in comparison during 2019-2021 in comparison during 2019-2021
sales revenues˄18% weight˅ sales revenues˄18% weight˅
The average growth rate of net profits for net assets˄13% weight˅ The average growth rate of net profits for net assets˄13% weight˅
the last three years˄15% weight˅ the last three years˄15% weight˅
The average growth rate of net profits The average growth rate of net profits
sales revenues for the last ˄13% weight˅ sales revenues for the last ˄13% weight˅
three years˄14% weight˅ three years˄14% weight˅
The ratio of international The ratio of international
revenues to total sales return on total assets revenues to total sales return on total assets
revenues˄6% weight˅ ˄8% weight˅ revenues˄6% weight˅ ˄8% weight˅
figures of 2020
figures of 2019 sales revenues figures of 2019 sales revenues
figures of 2020 contribution per employee return on net assets figures of 2021 contribution per employee return on net assets
figures of 2021 ˄5% weight˅ ADVA ˄8% weight˅ ˄5% weight˅ NEC ˄8% weight˅
24