
Page 47 - Market Analysis Report of Optical Communications Field in China & Global market 2018
P. 47
the standard G.657.A1, thereby meeting various harsh and complex (110μm2) optical fiber in an optical cable pipe of a GYTA for TCT
environment requirements in the actual deployment of the terrestrial experiment; the following figure shows the schematic diagram for our
cable application. optical cable structure.
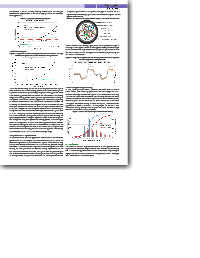
Figure 3 Comparison of macro-bending loss Figure 5 The figure below is the schematic diagram for optical cable structure
We can see from the following figure, when the temperature changes in
the range of -40 degrees Celsius to +70 degrees Celsius, the loss changes
3.3 Micro-bending loss of our ultra-low loss large effective area (110μm2) optical cable will be
Figure 4 Comparison of micro-bending losses between the ultra-low loss large less than 0.01dB / km and far superior to 0.05dB / km specified by the
effective area optical fiber and the standard G652 optical fiber IEC and ITU-T standards.
Figure 6 Changes in the optical fiber loss with temperature: 12 colors represent
the loss changes of 12-core optical fiber
3.5 Loss changes during the cabling
The most worried thing for the use of the large effective area optical In 2016, YOFC provided about 21,000Fkm Farband®Ultra-110 fiber to
fiber on land is the micro-bending performance. Micro-bending is an China Mobile. The following figure shows the loss changes for YOFC
important factor affecting the cabling design and cabling process, better ultra-low loss large effective area optical fiber before/after the cabling.
micro-bending performance can reduce the difficulties in the cabling The blue bar is fiber loss distribution before cabling and the blue line is
design and cabling process and improve the performance stability of the low accumulative data of the fiber; the red bar is the loss distribution
the optical cable under different application conditions, especially after cabling and the red line is the low accumulative data of the cable.
in extreme environments. But the current mainstream methods for The typical loss before cabling is about 0.158dBkm, while the cables’
increasing the effective area of the optical fiber is to increase the fiber typical loss is about 0.161dB/km. In this project, we use the G.652.
core layer diameter or reduce the fiber core layer relative refractive D technical setting during the cabling and the ultra- low loss & large
index, both designs will have a negative effect on the micro-bending of effective fiber is stable during the cabling.
the optical fiber. For the ultra-low loss large effective area optical fiber
in YOFC Company, we have effectively reduced the micro-bending Figure 7 G.654.E fiber loss changes before/after the cabling
loss of the ultra-low loss large effective area optical fiber by using the
specially optimized and designed depressed trench structure design and
combining with the special optical fiber coating process. The above figure
shows the comparison of the micro-bending performances between
our ultra-low loss optical fiber with an effective area of 110μm2 and the
standard G.652.D single-mode fiber, it can be seen that our optical fiber
has excellent micro-bending performance and its typical micro-bending
loss is less than 0.5dB / km in the whole wavelength range.
3.4 Optical cable TCT performance
As discussed above, since the application environment of the terrestrial
optical cable is more complex and harsh than the environment of the
submarine optical cable, the terrestrials optical cable needs to keep
the link loss stability even under the more fierce temperature change 4. Conclusions
conditions. To further validate the performance of our optical fiber after The ultra-low loss and large effective area of YOFC optical fiber has
cabling, we have performed the relevant cabling experiments. In the super low loss coefficient, larger effective area, excellent macro-bending
summary of the relevant standards, the optical fiber temperature cycle and micro-bending performance as well as excellent adaptability of
test is commonly used to detect the changes in loss with temperature. deployment and is the best choice of the next generation 400G and super
In the experiment, we placed 12-core ultra-low loss large effective area 400G terrestrial communication system.
47