
Page 27 - Market Analysis Report of Optical Communications Field in China & Global market 2018
P. 27
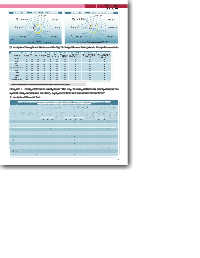
Chart4-10 The competitiveness analysis of Infinera in comparison during 2016-2018  Chart4-11 The competitiveness analysis of Sumitomo Electric during 2017-2018
                                 sales revenues˄18% weight˅                            sales revenues˄18% weight˅
                                  2.0000                                                 2.0000
            The average growth rate of net profit for the  1.5000  The average growth rate of net profit for the  1.5000
               last three years˄15% weight˅    net assets˄13% weight˅  last three years˄15% weight˅   net assets˄13% weight˅
                                  1.0000                                                 1.0000
                                  0.5000                                                 0.5000
                                  0.0000
                                                                                         0.0000
            The average growth rate of sales                       The average growth rate of sales
            revenues for the last three years  -0.5000    net profit˄13% weight˅  revenues for the last three years  -0.5000  net profit˄13% weight˅
                ˄14% weight˅      -1.0000                             ˄14% weight˅       -1.0000
           The ratio of international revenues to  return on total assets  The ratio of international revenues to  return on total assets
            total sales revenues˄6% weight˅                       total sales revenues˄6% weight˅
                                                   ˄8% weight˅                                           ˄8% weight˅
                figures of 2016                                                                    return on net assets
                figures of 2017  sales revenues contribution  return on net assets  figures of 2017  sales revenues contribution  ˄8% weight˅
                figures of 2018  per employee˄5% weight˅  Infinera  ˄8% weight˅  figures of 2018  per employee˄5% weight˅  Sumitomo Electric
         Ⅳ Analysis of Strength and Weakness of the Top 10 Competitiveness Enterprises in Competitiveness Index


            Table 4-2 The analysis of the strength and weakness index among the enterprises in the optical transmission and network access equipment field of Global market
                               Sales           Return on  Return on  Sales revenues  The ratio of  The average growth rate   The average growth rate
               Company   Ranking   Net assets Net profit    contribution per  international revenue  of sales revenues for the  of net profit for the
                              revenues         total assets net assets  employee  to total sales revenues  last three years    last three years
                Huawei     1    ĭ     ĭ     ĭ     į      į      į          į             į             į
                Nokia      2    ĭ     ĭ     į      į      į      į         į            ĭ              į
                Ciena      3    ĭ     ĭ     ĭ     į      į      į          į             į             ĭ
                ZTE        4    ĭ     ĭ     į      į      į      į         į             į             ĭ
           FiberHome Communications  5   ĭ     į      į      į      į      į      į     ĭ              į
                Fujitsu    6    ĭ     ĭ     į     ĭ     į       į          į             į             į
                NEC        7    ĭ     ĭ     į     ĭ     į       į          į             į             į
                ADVA       8    į      į      į      į      į     ĭ       ĭ             ĭ              ĭ
                Infinera   9    ĭ     ĭ     ĭ     į      į      ĭ         ĭ             ĭ              į
             Sumitomo Electric  10    į     ĭ    ĭ    ĭ    ĭ     į        ĭ              į             ĭ

            Note 2:The explanations of the strength and weakness index system refer to the Note 7, page35
          Chapter 5   Competitiveness Analysis of "the Top 10 competitiveness enterprises in the

          optical components and auxiliary equipment field of Global market in 2018"
          Ⅰ Analysis of Financial Data


                  Table5-1 The standard value weighted of financial data of the top 10 competitiveness enterprises in the optical
                                     components and auxiliary equipment field of Global market in 2018
                                                                   The standard value weighted of financial data
                                              Scale sub-factors˄weight 44%˅  Efficiency sub-factors˄weight 27%˅  Increase sub-factors˄weight 29%˅
                                                                                                The   The
                                    Total
                                                                          Sales
                                                                                               average
                                                                                                     average
                    Ranking of  Ranking of  standard            Return  Return  revenues  The ratio of  Ranking of  growth rate  growth rate
                                                                              international
                                                                                     Total
                                                       Total
                                                                                                           Total
            Company  comprehensive  financial data  value  Sales  Net  Net  standard  Ranking of  on total  on net  contribution   revenue  standard  standard  of sales  of net  standard  Ranking of
                                                                                                                standard
                                                           standard
                   competitiveness  competitiveness  weighted of  revenues  assets  profit  assets  assets  per  to total sales  value   revenues  profit
                      index  index   the               value  value                  value  weighted       value  value
                                   financial data     weighted weighted  employee  revenues  weighted  of  for the last  for the last  weighted  weighted
                                                      of scale  of scale           of efficiency  efficiency   three years  three years of increase of increase
                                         weight  weight  weight  index  index  weight  weight  weight  weight  index  index  weight  weight  index  index
                                          18%  13%  13%          8%  8%   5%   6%               14%   15%
             Finisar   1      1      1.9711    1.0492   0.0887   0.9254   2.0632   1   0.0354   0.0111    -0.1618    0.0241    -0.0912   7   -0.0004    -0.0005    -0.0009   8
             Broadcom  2      2      1.8147    0.7062   0.1092   0.5973   1.4127   2   0.0108   0.0070    0.3156    0.0463    0.3797   2   0.0065    0.0158    0.0223   2
             Lumentum  3      3      0.9822    0.6141   0.0255   -0.6671   -0.0275   11   -0.0548   -0.0211    1.0908    0.0396    1.0546   1   -0.0005    -0.0444    -0.0449   10
             Accelink  4      4      0.7880    0.4684   0.0166   0.2031   0.6881   4   0.0409   0.0129    0.0530    -0.0118    0.0949   3   0.0016    0.0034    0.0050   5
           Sumitomo Electric  5  5   0.7436    0.4391   0.0516   0.3656   0.8563   3   0.0302   0.0109    -0.1720    0.0170    -0.1139   9   -0.0010    0.0021    0.0011   7
             Fujikura  6      6      0.4342    0.2478   0.0153   0.2736   0.5368   5   0.0225   0.0146    -0.1679    0.0180    -0.1128   8   -0.0009    0.0111    0.0102   4
           Furukawa Electric  7  7   0.4337    0.1477   0.0332   0.2381   0.4191   6   0.0286   0.0093    -0.0329    0.0062    0.0112   6   -0.0018    0.0052    0.0034   6
           Hisense Broadband  8  8   0.4236    0.2742   0.0050   0.0871   0.3663   7   0.0210   0.0078    0.0303    0.0012    0.0603   4   -0.0008    -0.0022    -0.0030   9
           Zhongji Innolight  9  9   0.4211    0.1437   0.0251   0.0533   0.2222   8   0.0051   0.0026    0.0203    0.0315    0.0595   5   0.0705    0.0688    0.1394   1
              O-net   10      10     -0.0959    0.0735   0.0015   0.0625   0.1375   9   0.0482   0.0140    -0.3213    0.0116    -0.2475   11   0.0030    0.0111    0.0141   3
                                                                                                                    27